PnL across your trading periods
Review realised PnL for today, this week, this month and this quarter, with account-currency and percentage views.
FEATURES · CURRENT WINDOWS ALPHA
Explore GunterChart’s charting, market context, risk controls and trade management. These captures show the actual app, taken on 3 November 2026.
01 · MARKET CONTEXT
Your watchlist and economic news sit beside the chart, so the information you use is close to the work you are doing.
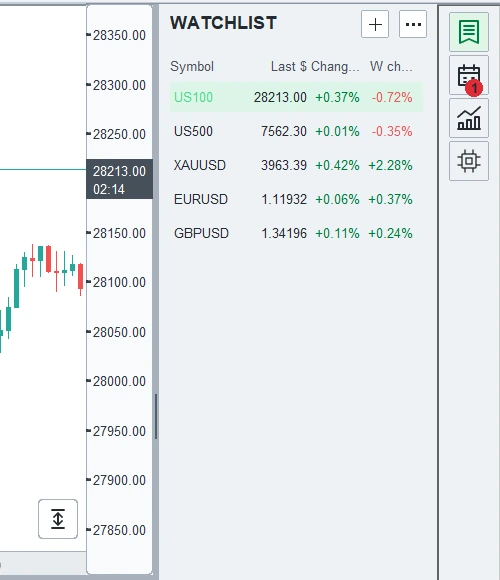
Keep a selection of symbols and their displayed market changes together in one panel.
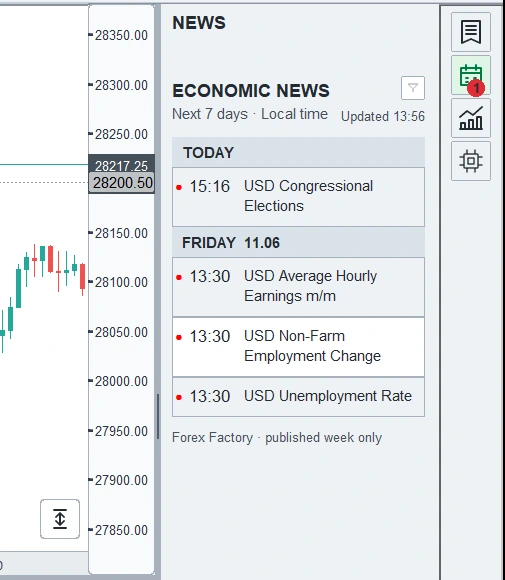
See scheduled releases and their displayed impact from the news panel alongside your chart.
Review realised PnL for today, this week, this month and this quarter, with account-currency and percentage views.
See economic-event markers on your chart as well as in the calendar. Currency and impact filters help keep the relevant events in view.
Keep actionable messages close to your workspace, including connection and update notices. An optional candle-close alert sounds with 10 seconds remaining.
02 · DRAWING & ANNOTATION
Draw lines and highlight areas, then adjust their appearance without leaving the chart.
Draw lines, mark levels and highlight areas directly on your chart. Adjust the selection with visible handles and appearance controls.
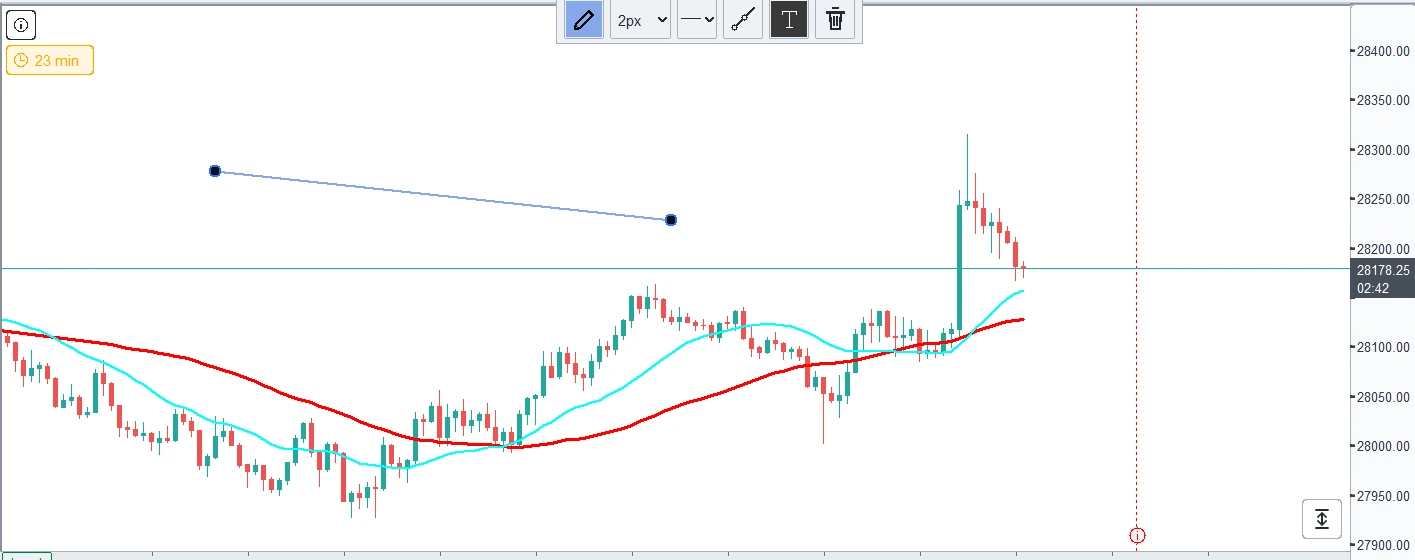
Place a line over the chart and adjust its endpoints using the selection handles.
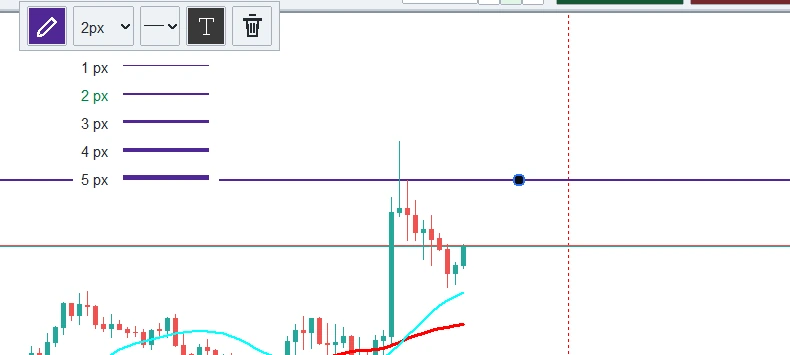
Choose how prominently a line appears, from 1 to 5 pixels.
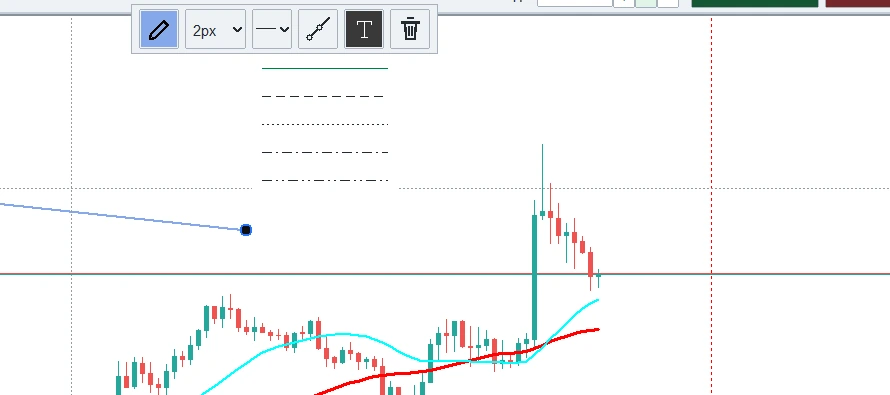
Use different line patterns to distinguish your annotations.
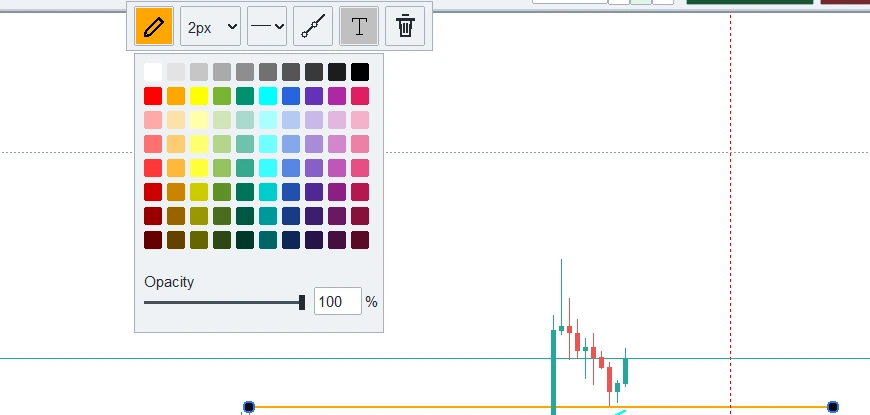
Choose a colour and adjust opacity to keep the chart underneath visible.
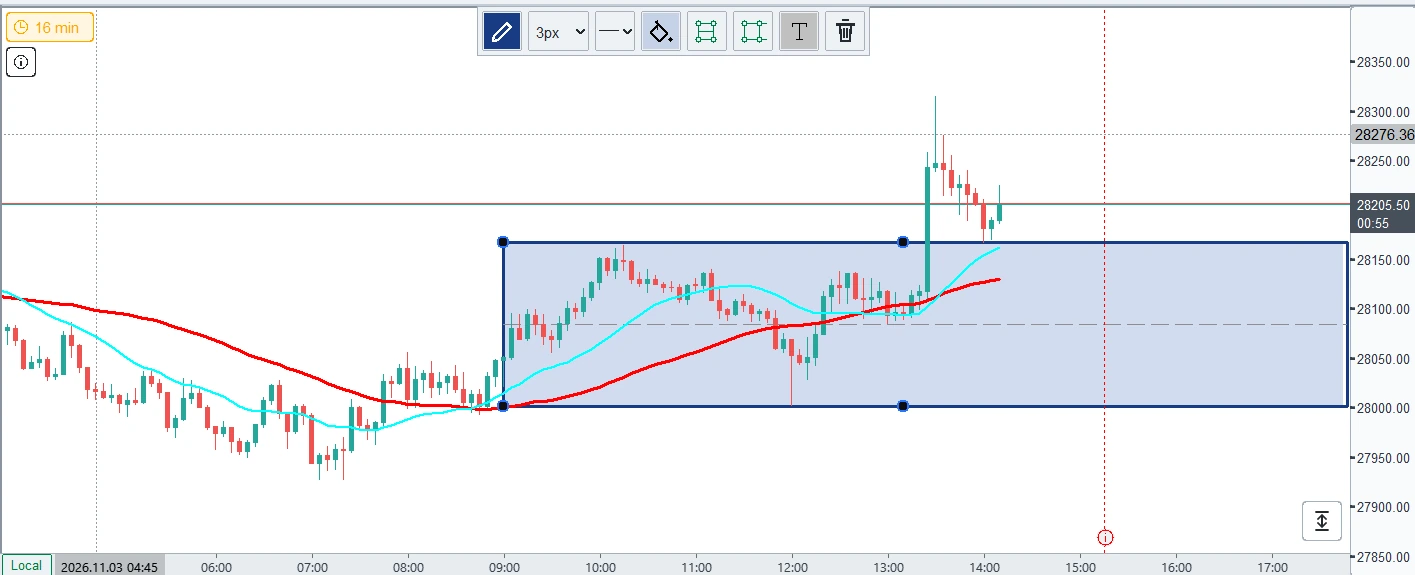
Use a shaded box to mark a zone you want to watch or review. Adjust it with the visible corner handles.
TRADE MANAGEMENT
An overhauled trade manager brings open positions, pending orders and trade actions into the charting workspace.
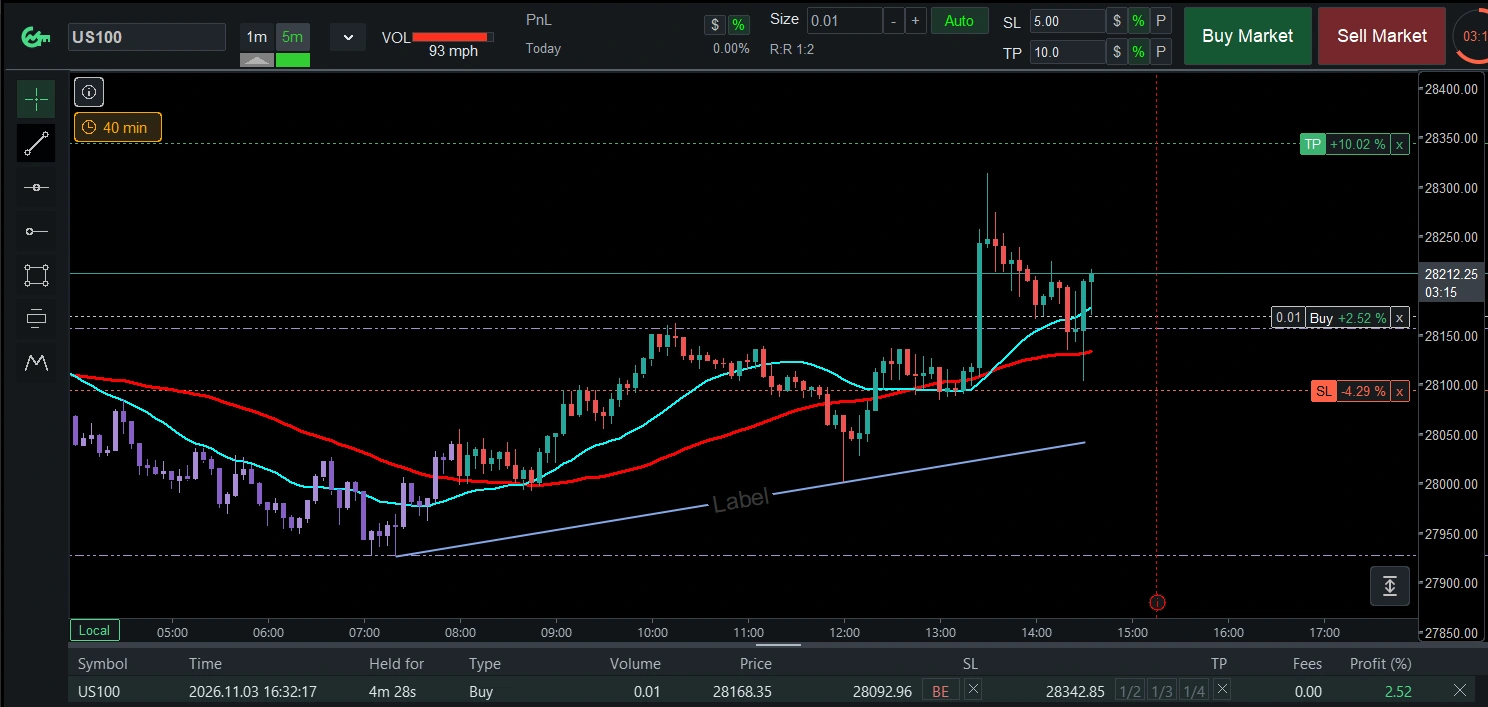


Review open positions, pending orders, history and trade details in one workspace. Keep management actions close to the rows and chart you are using.
Choose your risk and stop-loss distance, then let Auto calculate the size for a new order using the broker’s lot limits.
Apply your configured stop loss and take profit when placing orders through GunterChart. These settings apply to GunterChart’s order flow.
Set stop-loss and take-profit amounts in account currency, percentages or points, using the units that suit your plan.
Adjust a trade’s stop-loss or take-profit handle directly on the chart. Releasing the handle submits the change.
Move a position’s stop loss to entry from the trade manager. BE+ can include your configured fee estimate where supported.
Close an exact half, third or quarter from an eligible position on a hedging account, subject to the broker’s volume limits.
Read position PnL in account currency or percentages on the chart. The trade manager also offers a points view for individual positions.
Close a position or cancel a pending order using its chart control, with the trade you are managing kept in view.
03 · CHART TOOLS
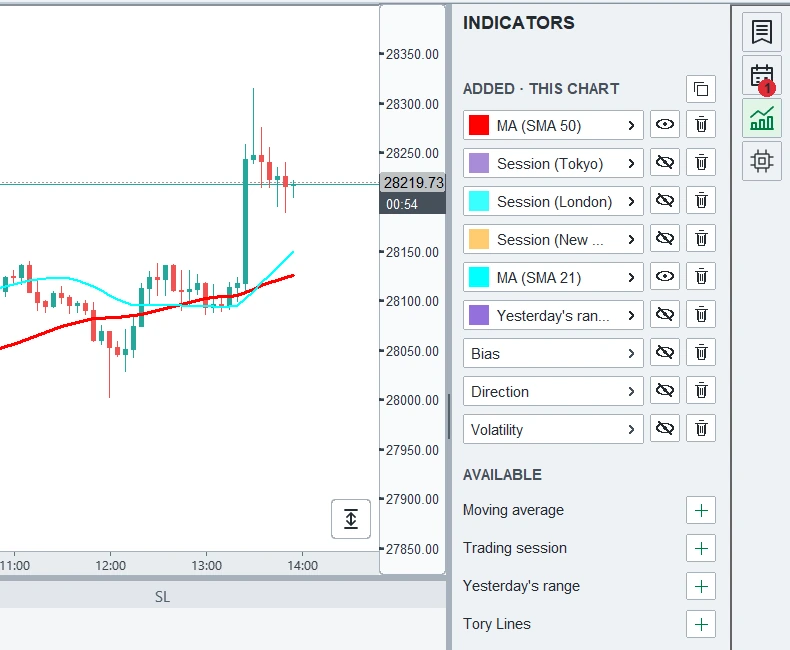
Review the indicators added to your chart and use the panel’s visibility and removal controls. The capture includes moving averages and trading sessions.
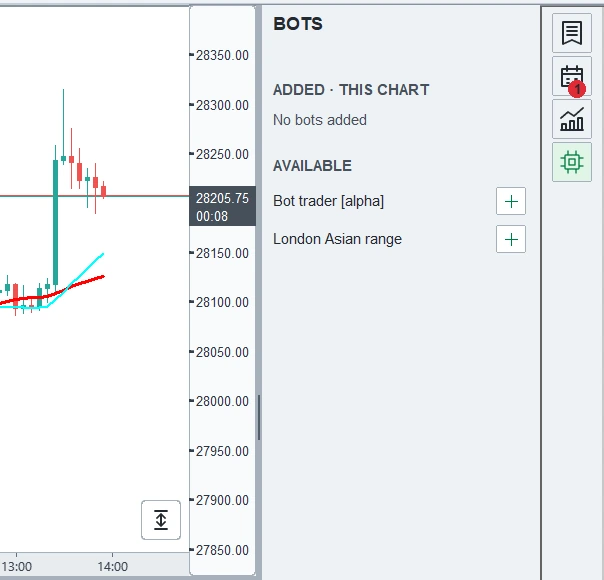
View the bots listed for this chart and the available entries in the alpha panel. The capture shows the panel before any bot has been added.
04 · APPEARANCE
Switch between light and dark themes, customise candle colours, background and grid, and set chart margins. Keep the same workspace while choosing the view that suits you.
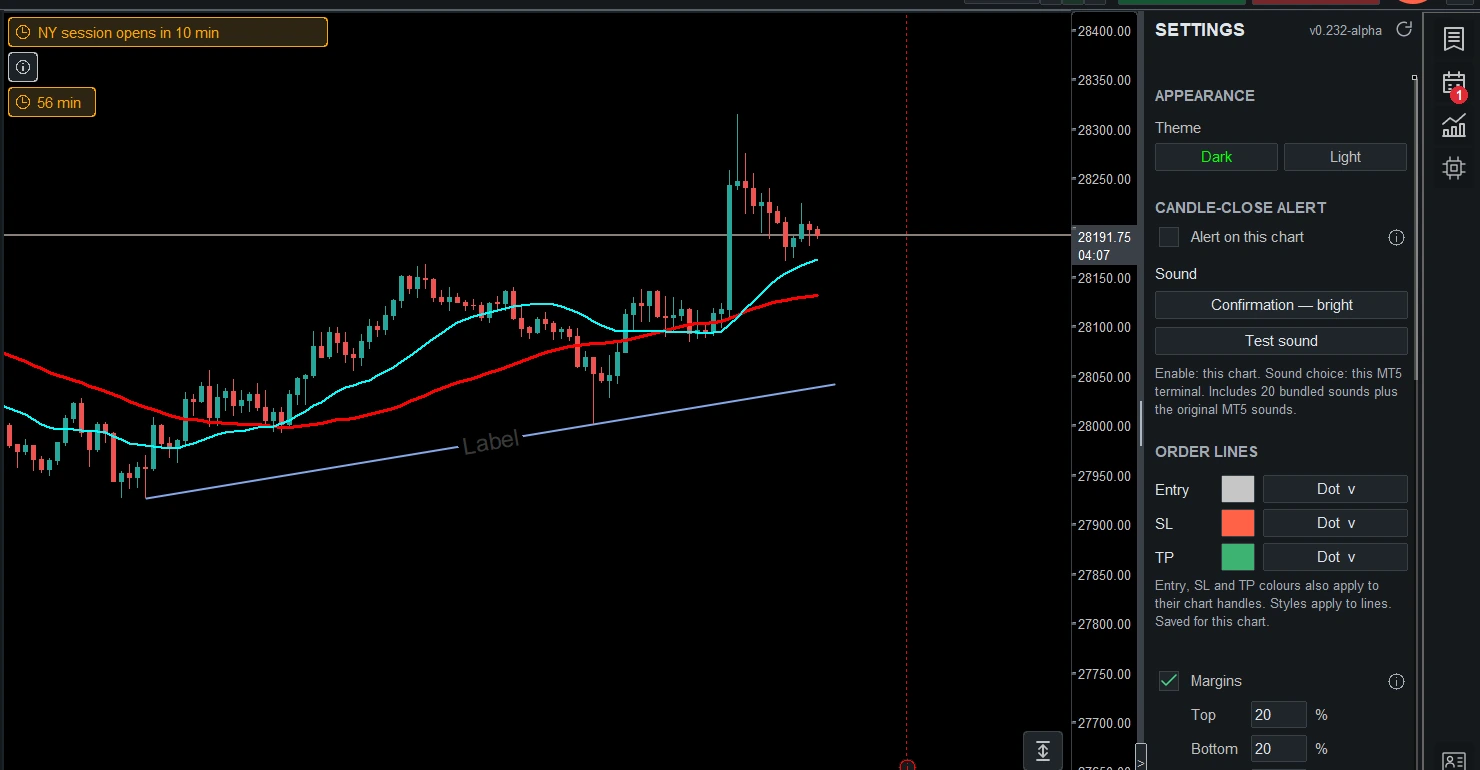
Choose your theme, candle colours, background and grid. Adjust top, bottom and right margins to leave the space you want around the chart.
Drag the price and time scales to adjust the chart view, with clear labels that stay beside the plot.
See the time remaining in the current candle beside the current price, so it is visible where you are already looking.
LIGHT OR DARK
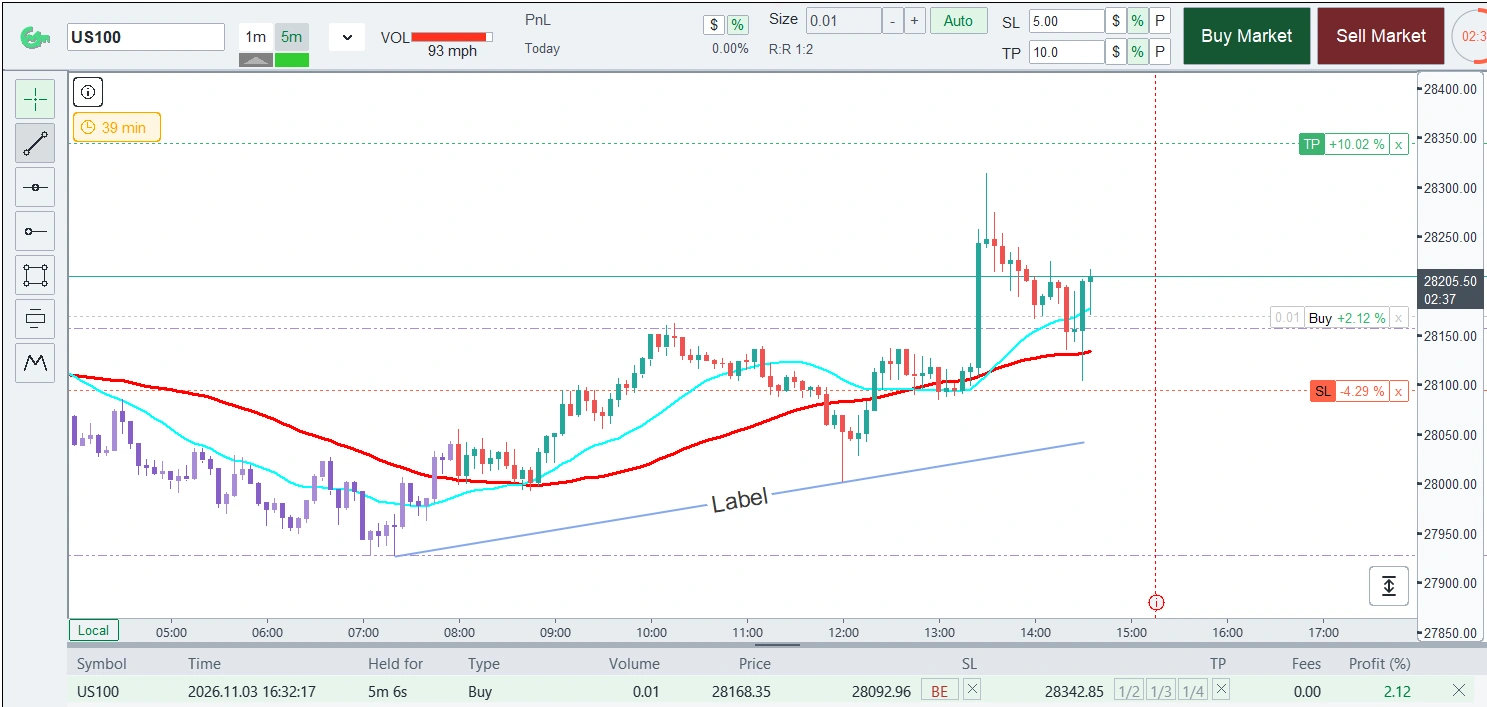
MORE CONTEXT, IN DARK MODE
The same workspace, with a darker canvas and chart context close at hand.
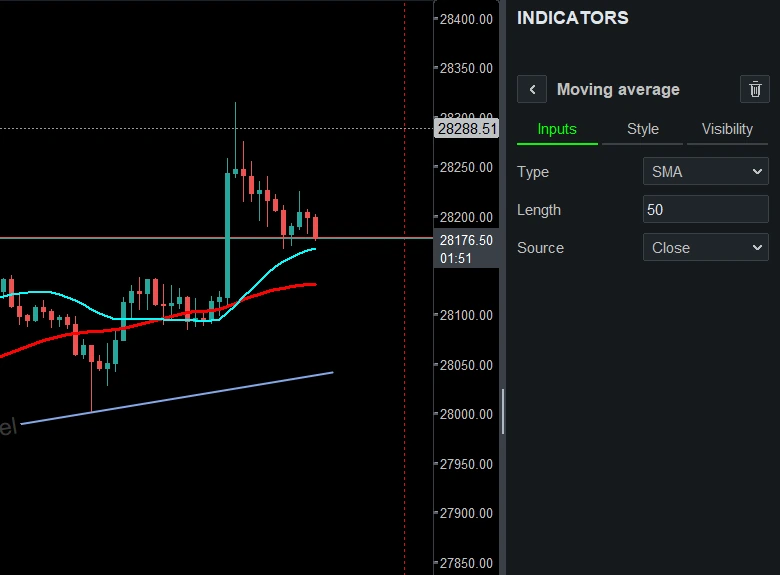
Review the moving average inputs from the indicator panel while keeping the chart visible.
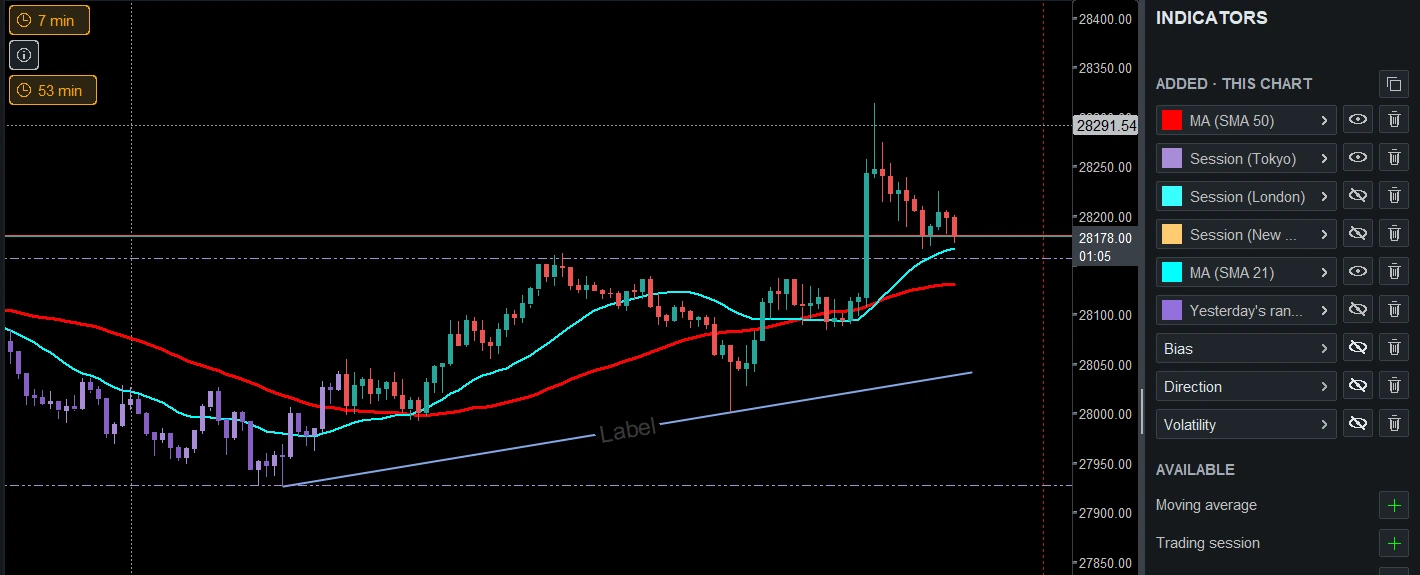
Keep session context and your indicator list beside the price chart.
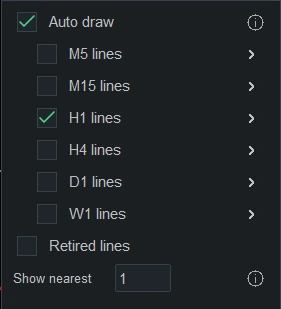
Automatically display chart lines for your selected timeframes. Choose the frames, appearance and nearest lines shown in the auto draw view.
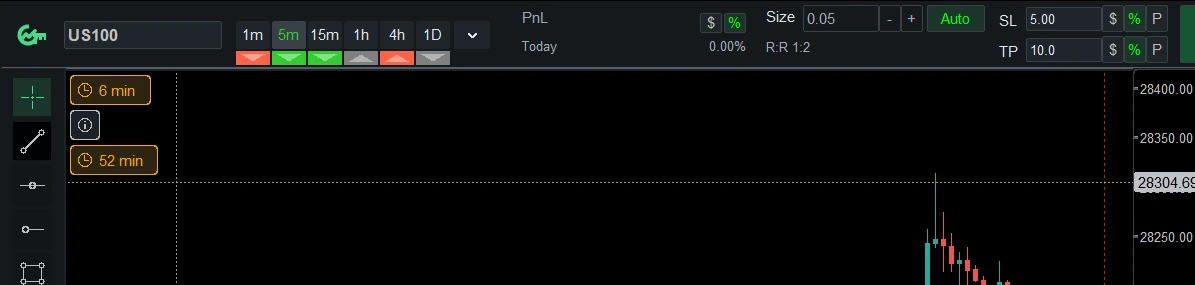
A compact bias strip brings a moving-average-based view across your chosen timeframes into the top toolbar.
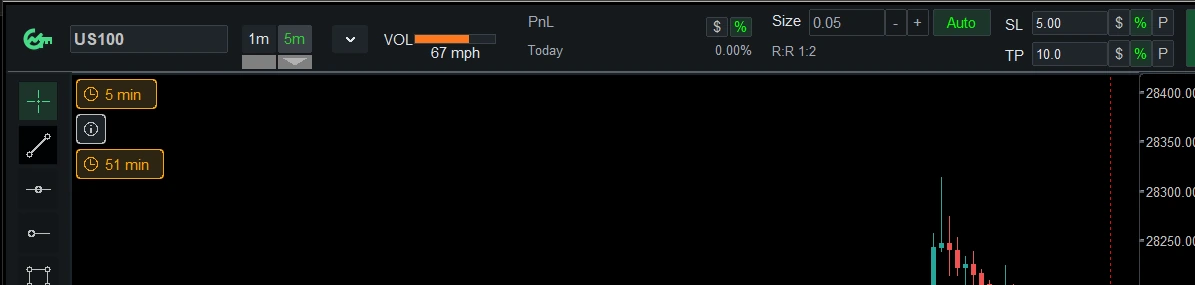
View a compact volatility readout in the top toolbar to keep recent market activity visible alongside your chart.
US$39 · Lifetime access · Five PCs · All future updates
LIMITED FOUNDING OFFER · 500 LICENCES TOTAL
US$39
Purchases are not open yet. No payment will be taken here.
Applicable tax and the final total are shown at checkout.
After the 500 founding licences are sold, new purchases will move to monthly subscription plans. Founders keep lifetime access, five PCs and all future updates.
Link is the merchant of record for payments through Stripe Managed Payments and sends payment receipts, invoices and refund messages. GunterChart provides product and licence support.
Terms · Refund policy · Privacy
Setup and requirements · Known issues
Keep this tab and your purchase email for payment status and access recovery.
Download the ZIP and extract it. Open only the Helper file deliberately downloaded here. If Windows says “Windows protected your PC” because the app is not recognised, select “More info”, check that the file is the expected GunterChart Helper, then “Run anyway” only if you trust this download. For malware alerts, unexpected files, connection or certificate failures, or an unavailable “Run anyway” option, stop and contact support. Do not turn off protection software.
Need your email or a fresh download link? Contact support. Do not send card details, passwords or your full licence code.
YOUR NEXT WORKSPACE
For purchase, licence or installation help, contact support.
Contact support